See what's going well and where adjustments are needed
Bring together bookings, proposals, ticket sales, guide feedback, and sales figures in clear overviews. This way, you can discuss results based on the same information.
Make team meetings more concrete
It may feel as though more requests are coming in, certain tours are selling better, or guides are taking longer to respond.
But a feeling alone doesn't give your team a shared starting point.
With the reports in Eguide, you can view the most important results based on the same information you work with every day.
This way, during a meeting, you can discuss in more concrete terms what is happening, where follow-up is needed, and which questions require further investigation.
You don't have to consolidate data from different files and mailboxes first.
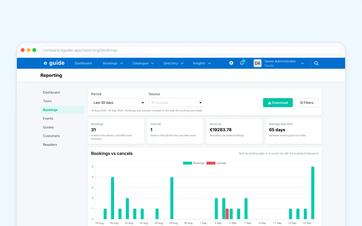
See how requests and bookings move through the system
A high number of requests does not automatically mean that there are more confirmed or completed bookings.
That's why you want to know not only how many files there are, but also where they are located.
Among other things, you can track how many bookings, proposals, and ticket sales were recorded during the specified period.
This makes it clearer where customers still need to make decisions, where your team still needs to take action, and which activities have actually been completed.
Use the figures to go back to day-to-day operations
A report gives you the bigger picture.
If a figure raises questions, go back to the underlying summary to review the specific entries or proposals.
This way, reporting remains linked to the cases your team works on every day.
To get a quick overview of what needs your attention today, use the central operational dashboard.
See what insights you can gain from your day-to-day operations
We track bookings, guide reviews, and sales value within a single period.
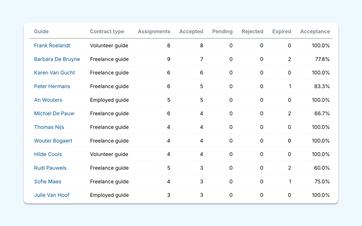
Understand how guides respond to assignments
A large database of guides is only valuable if you also know how to put it to use in practice.
Reports and guide overviews help you see how many requests have been accepted, rejected, or are still awaiting a response.
Completed and canceled orders also remain identifiable.
This will help you better assess where dispatch runs smoothly and where assignments more often require additional follow-up.
Look beyond a single comment
A guide may refuse one assignment for a valid reason.
That, in itself, says little about the full extent of the collaboration.
When you look at feedback regarding long-term performance as a whole, you gain more context. For example, you can see who frequently accepts assignments, where many requests go unanswered, and how many different tours someone leads.
This information supports a discussion with the guide or the dispatch team. It does not replace human judgment regarding deployment or quality.
You can read about how language skills and tour knowledge are documented for each guide in the overview of guide qualifications.
View the exact time period that matches your question
You can use the available time period options or enter your own start and end dates. This allows you to analyze, for example, a campaign period, a season, or a quarter of your choice without being limited to fixed presets.
Compare key figures with the previous period
For key metrics such as revenue, bookings, tickets, and average sales, Eguide shows the change compared to the same period last year. This allows you to see not only the current figure, but also whether it is increasing or decreasing.
If you want to further process the underlying data afterward, you can export operational and tax data.
Frequently Asked Questions About Reports
Practical answers about numbers and results.
Eguide displays operational metrics, including bookings, proposals, ticket sales, and guide requests. Depending on your access level, financial figures and total sales revenue may also be visible.
No. The graph combines the value of private tours conducted and event tickets sold.
It is not based on invoices or recorded payments and should therefore be interpreted as realized sales value, not as accounting revenue.
No. The reports and statistics use predefined time periods. This means you cannot freely choose any possible start and end dates.
No. The reports do not automatically compare the data to previous months or years. You view the results for the selected period on their own.
No. Eguide provides targeted overviews of a company's own operational and financial performance.
It is not a fully customizable environment where you can freely combine charts, formulas, and data sources as you see fit.
Can't find your question here? Please contact us. We'd be happy to review which results you're currently compiling manually for discussion and follow-up.