Start your day with a look at what's happening
Review the key metrics for bookings, proposals, tickets, and guide feedback before opening individual cases. This will help your team quickly identify where further follow-up is needed.
See where your team needs to look next
How many new bookings have come in? Which requests have already been approved? Have more tickets been sold recently? And are the guides responding to the assignments you've sent them?
When each answer is listed in a separate table, an operational discussion quickly turns into a search for information.
The Eguide dashboard brings together the most important metrics in one place. You can quickly get an overview of what’s happening within your organization and then click through to the area that requires further attention.
The dashboard does not replace the underlying files. Its main purpose is to help you figure out where to start more quickly.
See how many bookings are in each stage
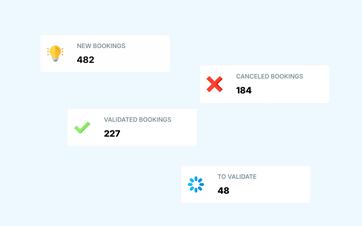
At the top of the dashboard, you'll see counts for key booking statuses, such as new, validated, canceled, and rejected bookings.
This allows you to quickly see, for example, if there are a lot of new requests waiting to be reviewed or if a notably large number of bookings have been canceled.
If you want to know which files are involved, go to the bookings where customer information, groups, guides, and financial tracking are all listed.
Track recent sales activity
The dashboard also shows how the number of new bookings, proposals sent, and tickets sold has changed over the past few days.
This makes it easier to see whether there has been more or less activity recently, without having to open three separate lists first and tally the numbers yourself.
This brief review is intended for daily monitoring. For more detailed analyses covering other periods, please refer to the operational and financial reports.
See what kind of feedback your team needs on a daily basis
We'll walk you through the dashboard using examples from your own operations.
See how guides respond to assignments
The dashboard shows how many guide requests have been accepted, rejected, or are still pending.
This gives you a quick overview of the current guide schedule. When there are many pending requests, dispatch knows that further follow-up may be needed.
You can also see which guides have recently accepted, declined, or are still reviewing a large number of requests. These figures provide context, but do not constitute an automatic evaluation or ranking of the best guides.
For specific responses and related cases, you can open the recent reports and go directly to the appropriate entry or assignment.
Record a manual valuation where necessary
For each guide and tour, you can assign an internal rating of one to five stars. Eguide does not automatically calculate this score based on acceptances, rejections, or other statistics.
Combine the numbers with your specific plan
In addition to key figures, the dashboard also includes a calendar with daily, weekly, and monthly views, as well as a section with recent notifications.
From the calendar, you can open the relevant booking via the booking view. This allows you to quickly navigate from a figure or a planned assignment to the file that requires your attention.
Compare the current and previous periods
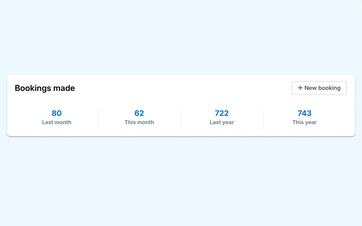
The dashboard includes figures for this month and last month, as well as this year and last year, among other periods. For more detailed analyses, you can proceed to the operational and financial reports, where you can also specify custom start and end dates.
Frequently Asked Questions About the Operational Dashboard
Practical answers about your statement.
The dashboard displays figures for key booking statuses, recent activity related to bookings, proposals, and tickets, guide responses, and sales revenue generated.
It is intended to quickly identify areas where further follow-up may be needed.
The dashboard first provides a general overview. For specific cases and further processing, go to the corresponding transactions, proposals, or planning overview.
There you'll find all the information and available promotions.
No. The reports and statistics use predefined time periods. This means you cannot freely choose any possible start and end dates.
No. The reports do not automatically compare the data to previous months or years. You view the results for the selected period on their own.
No. The graph combines the value of private tours conducted and event tickets sold.
It is not based on invoices or recorded payments and should therefore be interpreted as realized sales value, not as accounting revenue.
Access to operational statistics and financial figures depends on the settings configured user rights.
An employee can therefore have access to operational figures without automatically being allowed to view all financial information.
Can't find your question here? Please contact us. We'd be happy to help you determine what insights your team needs from the dashboard.